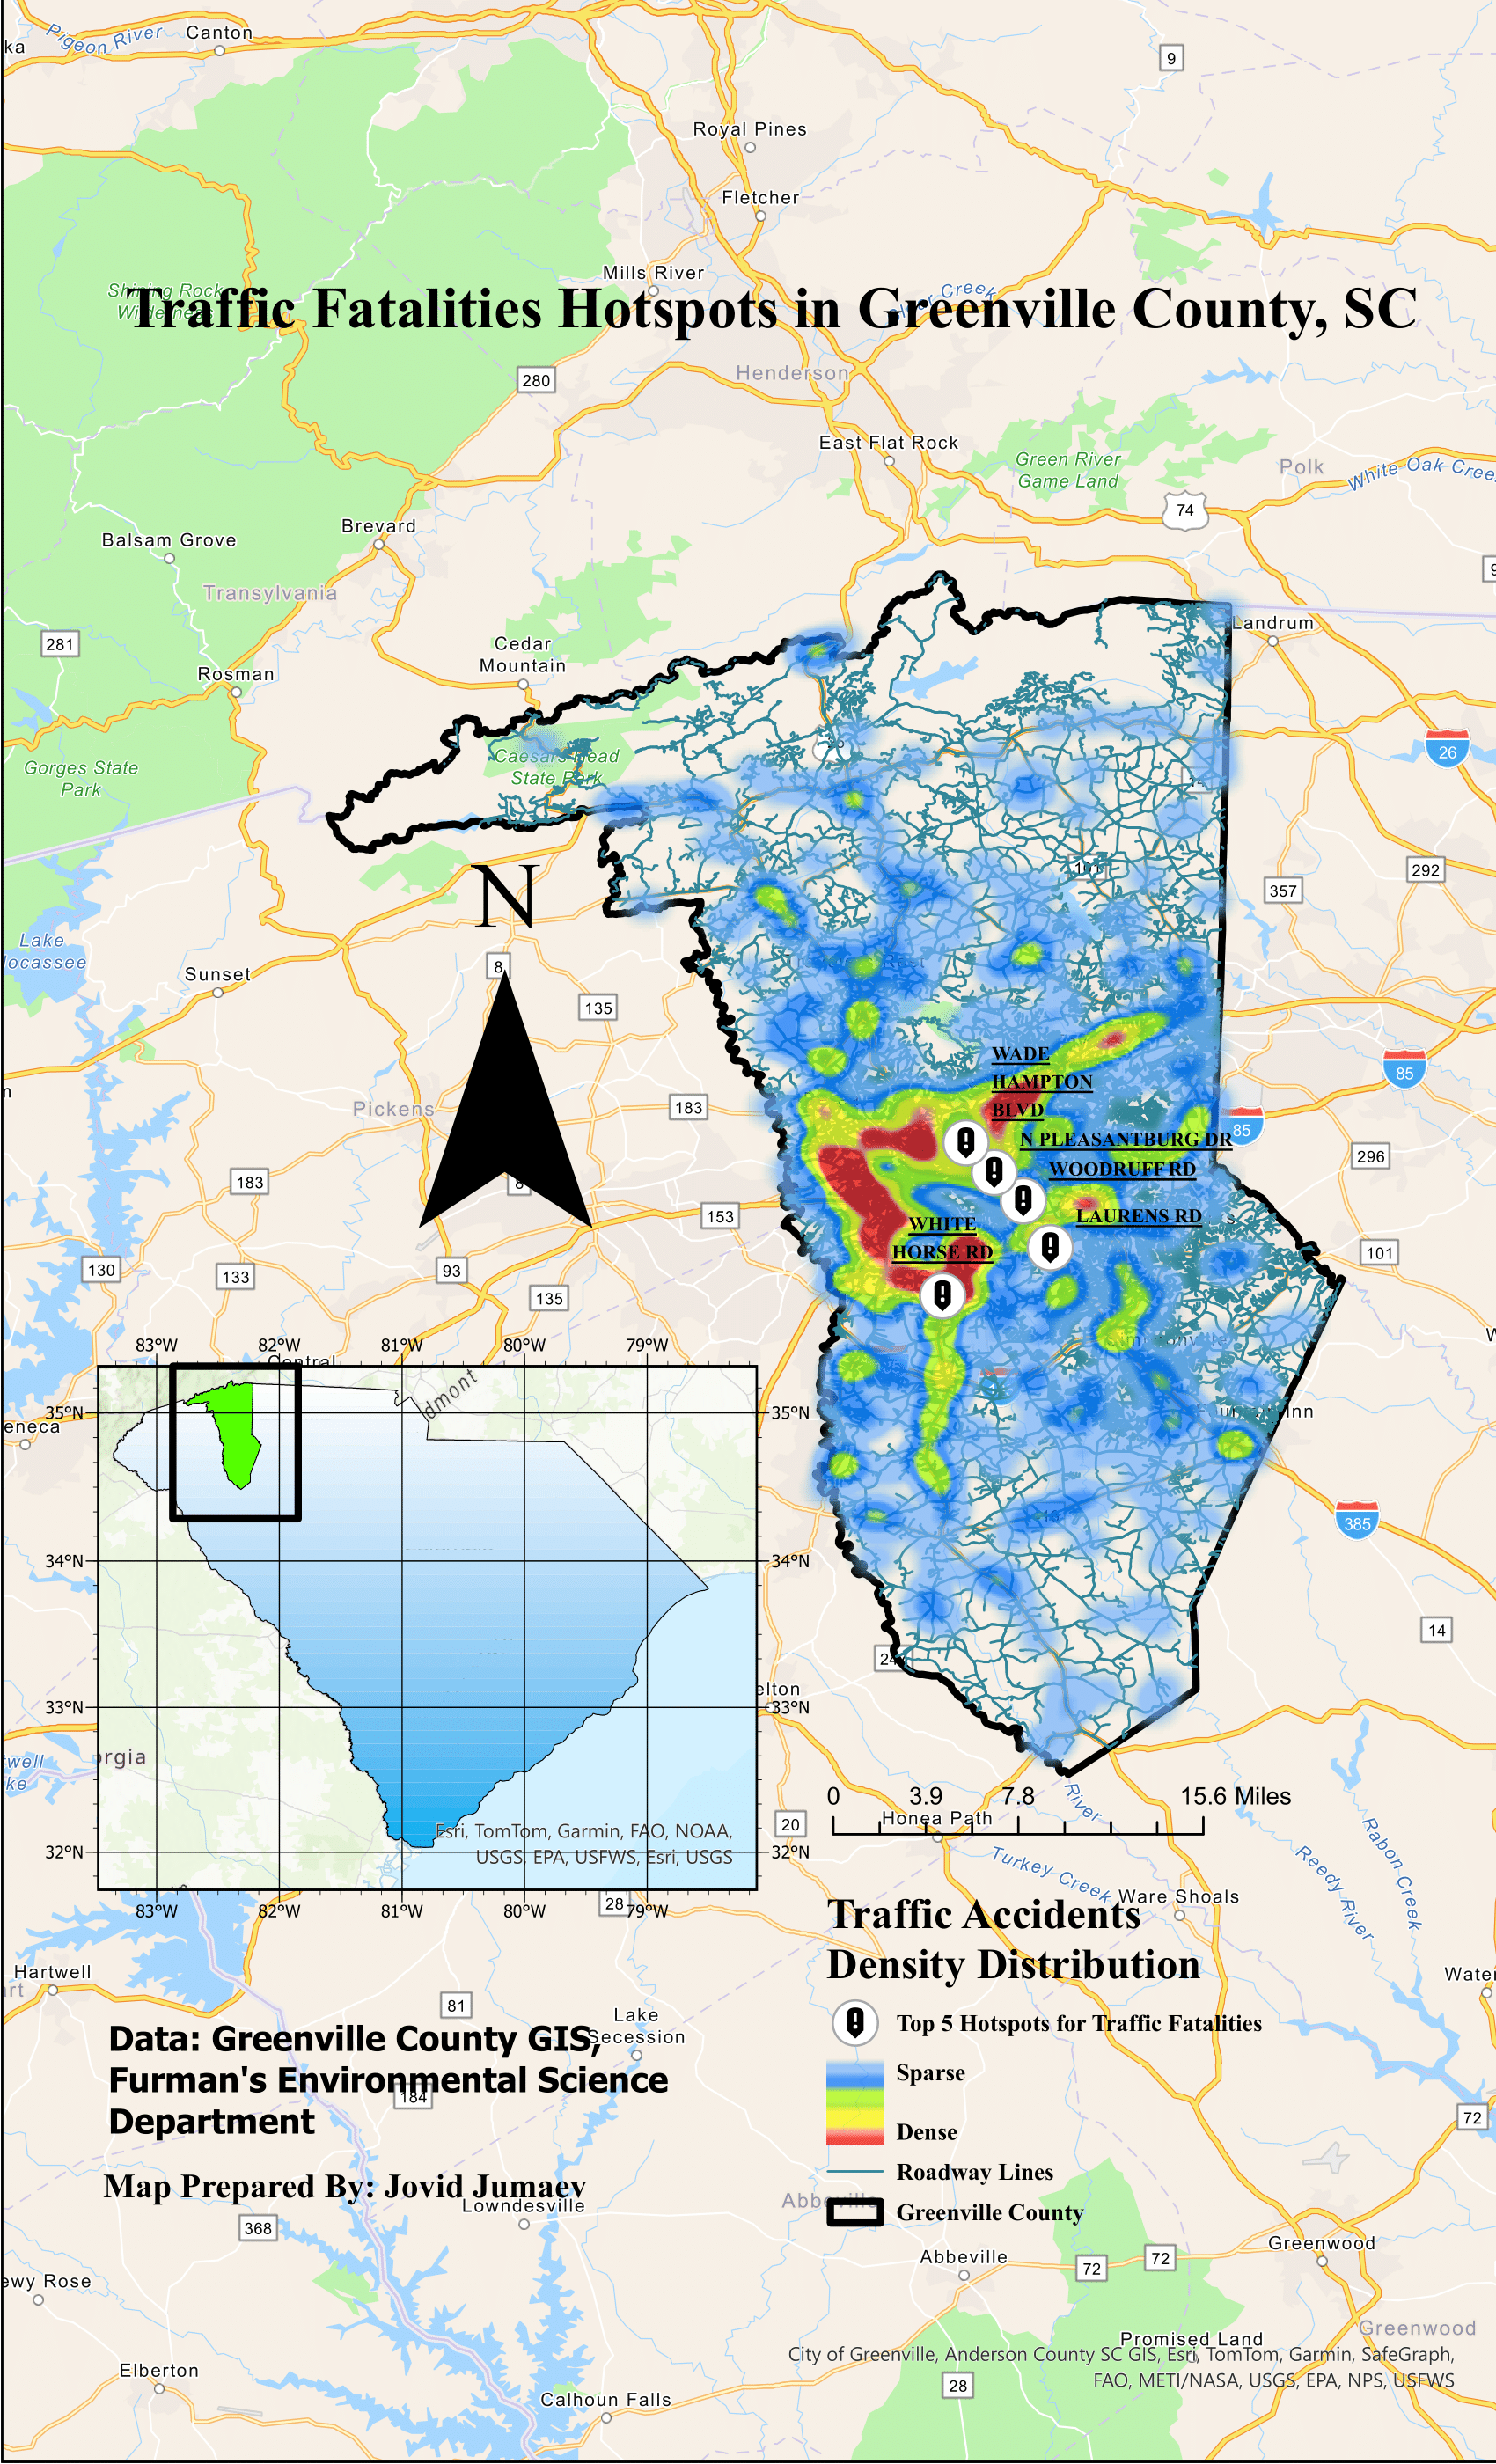
Spatial Analysis of Traffic Accident Hotspots


Overview
Have you ever wondered where and why most traffic accidents happen? In Greenville County, South Carolina, our project dives into 9 years of accident data (2014–2023) to uncover the top accident hotspots. Using tools like Python and GIS, we explored factors like bad weather, speeding, and road design. The goal? To make our roads safer by turning data into action.
Background & Objectives
Driving through Greenville County, I often noticed the challenges on roads like Woodruff Road, known for its heavy traffic and frequent accidents. This project was inspired by those observations and aimed to:
- Spot accident-prone areas using maps and data.
- Understand how weather and road conditions impact accident severity.
- Recommend ways to improve traffic safety.
Results
- Hotspots: Woodruff Road, White Horse Road, and Wade Hampton Boulevard topped the list.
- Weather: Rain and fog made accidents more severe.
- Speeding: A major cause of accidents, especially on highways.
- Failing to Yield: A common issue at intersections.
Recommendations
- Install speed cameras to discourage reckless driving.
- Improve street lighting on poorly lit roads.
- Introduce roundabouts to reduce accidents at busy intersections.
- Run public safety campaigns to educate drivers.
Conclusion
This project shows how data can shine a light on the challenges our roads face. By identifying accident hotspots and their causes, we can work towards creating safer streets for everyone. The findings not only help policymakers but also serve as a reminder of how small changes can save lives.